Tag: follow-through
Dogecoin (DOGE) Falls 10% to $0.17 as Whales Dump $74M Despite Nasdaq Merger Hype
In the past 24 hours, Dogecoin (DOGE)’s price slipped another 10% to $0. 17, extending a weekly drop of more than 27% as on-chain data showed whales unloading roughly 360 million DOGE ($74 million). Related Reading: Why The Dogecoin Price Could Still Hit A 600% Rally To Send It Above $1. 5 The selloff arrived despite upbeat headlines around House of Doge’s plan to merge with a Nasdaq-listed company and Thumzup’s exploration of DOGE payouts for creators. Initial excitement faded quickly as traders framed both developments as early-stage rather than immediately revenue-impacting, prompting profit-taking into thin liquidity. Broader crypto weakness, Bitcoin and Ethereum also retreating, amplified pressure on higher-beta meme coins like DOGE. DOGE’s price trends to the downside on the daily chart. 17 Support and $0. 21-$0. 23 Resistance Technically, DOGE is testing a make-or-break band near $0. 17-$0. 19, the lower boundary of a multi-week channel flagged by several analysts. Holding this area could fuel a rebound toward $0. 21-$0. 23, where a dense cluster of moving averages and prior supply capped every bounce this month. A daily close above $0. 221-$0. 23 would invalidate the short-term descending structure and open room toward $0. 25-$0. 26, while failure to defend $0. 17 risks a slide to $0. 16-$0. 15. Momentum gauges are cautious as RSI hovers near 45, signaling waning buying strength, and derivatives show mixed positioning, futures volume up, but open interest and funding largely neutral, implying traders expect volatility without a clear directional conviction. What Could Flip the Trend For a durable recovery, DOGE needs follow-through catalysts, not just headlines. Clear timelines on the House of Doge-Nasdaq merger (treasury operations, treasury size, revenue model) and a formal launch of Thumzup’s DOGE payouts would help convert narrative into flows. On-chain, a slowdown in whale distribution and renewed exchange outflows would tighten circulating supply, while spot bid depth must improve around $0. 18-$0. 19 to absorb shocks. Macro still matters: easing U. S.-China tariff rhetoric, improving risk appetite, and steadier BTC dominance could re-ignite meme liquidity. Related Reading: Solana Price At Risk Of 50% Crash To $104 After Forming This Larger Bearish Trend If bulls defend $0. 17 and reclaim $0. 21-$0. 23 on rising volume, a grind toward $0. 25-$0. 33 is back on the table. If not, the path of least resistance remains lower in the near term. For now, traders are treating rallies as tactical, and investors are watching confirmation signals before leaning back into the $1 long-term dream. Cover image from ChatGPT, DOGEUSD chart from Tradingview.
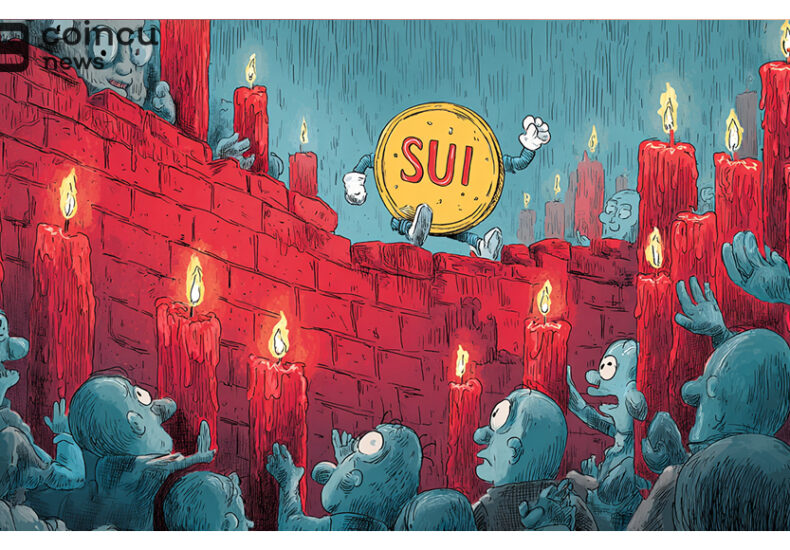
SUI Bounces at $2.55, But Heavy Sell Wall Looms
The post SUI Bounces at $2. 55, But Heavy Sell Wall Looms appeared com. Key Insights: SUI price holds support near $2. 55 but struggles to break resistance due to low buying volume. Higher lows on the weekly chart suggest structure remains valid despite strong overhead resistance. On-chain growth continues with rising TVL and new partnerships, but price awaits volume confirmation. SUI Bounces at $2. 55, But Heavy Sell Wall Looms Sui (SUI) was trading near $2. 68 after a weekly decline of over 20%. While the price remains above key support, weak momentum and strong resistance are limiting further upside. Traders are watching to see if the current range will hold or break in the coming sessions. Short-Term Support Holds Near $2. 55 The 4-hour chart shows SUI reacting around $2. 55-$2. 58, where it found support earlier in October. Each bounce from this level has struggled to gain follow-through. Price has failed to test nearby resistance zones between $2. 90 and $3. 40. Volume is low, suggesting limited buyer interest. The Relative Strength Index (RSI) sits near 40, pointing to a weak recovery after a dip into oversold territory. The lack of momentum is keeping the market in a tight range. Weekly Chart Shows Structure Holding On the higher time frame, SUI continues to form higher lows. It is still trading above the support zone near $2. 63, which was the base for the previous breakout in late 2024. This area has held through multiple pullbacks. Michaël van de Poppe commented that the pattern is still intact. He noted,“The structure hasn’t changed on UI,” referencing the ongoing higher lows as a sign that the trend is not broken. Resistance around $4. 20 has been tested several times, and the repeated attempts suggest that sellers may be weakening. He.
 The New York Times
- Trump’s Rift With Europe Is Clear. Europe Must Decide What to Do About It. 2026 年 1 月 22 日 Steven Erlanger and Jeanna Smialek
- Former Uvalde Officer Adrian Gonzales Found Not Guilty of Endangering Children in Mass Shooting 2026 年 1 月 22 日 Edgar Sandoval
- My Rohingya People Are Running Out of Time 2026 年 1 月 22 日 Lucky Karim
- China Wins as Trump Cedes Leadership of the Global Economy 2026 年 1 月 22 日 Peter S. Goodman
- Court Removes Restrictions on ICE’s Use of Pepper Spray, for Now 2026 年 1 月 22 日 Mitch Smith
- Snow Maps and More: Everything You Could Want to Know About This Winter Storm 2026 年 1 月 22 日 Nazaneen Ghaffar and Erin McCann
- Cuban Detainee in El Paso ICE Facility Died by Homicide, Autopsy Shows 2026 年 1 月 22 日 Pooja Salhotra
- Trump Drops Tariff Threats Over Greenland After Meeting With NATO Chief 2026 年 1 月 22 日 Lara Jakes, Jim Tankersley and Zolan Kanno-Youngs
- Heart Disease and Stroke Still Leading Causes of Death in U.S. 2026 年 1 月 22 日 Nina Agrawal
- An Unhinged President on the Magic Mountain 2026 年 1 月 22 日 Bret Stephens

